High CPU Usage/Load w/ Firefox-23.0 in Win7 Guest

spacewrench

Junior Member
High CPU Usage/Load w/ Firefox-23.0 in Win7 Guest [SOLVED]

UPDATE: Problem Solved. It seems to have been a Firefox / plugin issue, not Parallels.

I have Parallels 8 Desktop (Build 8.0.18608 Revision 898384; July 17, 2013) on a 2011 MacBook Pro (2.3GHz i7, 16GB RAM, Mac OSX 10.7.5). Guest is Windows 7 Pro (SP1, all updates). VM configuration is 6 CPUs, 8GB RAM. I am seeing high guest and host CPU usage when running Firefox-23.0 in the guest.

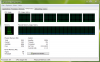
When the guest is idle, host CPU is about 17-20%:
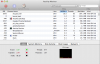
Screen Shot 2013-08-15 at 21.17.15.pngScreen Shot 2013-08-15 at 21.17.28.png

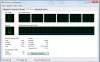
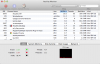
When running Chrome in guest (blank page), host CPU is slightly higher (20-25%):
Screen Shot 2013-08-15 at 21.19.43.pngScreen Shot 2013-08-15 at 21.19.51.png

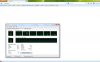
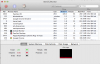
When running Firefox-23.0 in guest (blank page), host CPU is 110% and guest CPU is 16-17%:
Screen Shot 2013-08-15 at 21.22.14.png

Is it possible that Firefox is using a graphics feature that is not handled efficiently by Parallels Tools? How can I figure out what's wrong? (This is a recent development; previously, Firefox was well-behaved.)

Thanks!
 
Last edited:
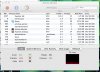
When running Firefox-23.0 in guest (blank page), host CPU is 110% and guest CPU is 16-17%:

As you can see on the latest screenshot of Activity Monitor, the CPU usage is actually 14.81% + 1.0% = 15.81%.
These 110% that you see for "Parallels VM" process are 110% out of 800% (you have 8 core Mac)

If you convert the guest CPU usage (16-17%) to the same values (16-17% * 6 VM CPUs) you'll get 96-102%. And this is what Activity Monitor is showing you.

This is because Task Manager in Windows and Activity Monitor in Mac use different notations:
* Highest possible CPU usage in Task Manager is 100% regardless of CPU count.
* Highest possible CPU usage in Activity Monitor is number of CPU cores * 100%
 
This is because Task Manager in Windows and Activity Monitor in Mac use different notations:
* Highest possible CPU usage in Task Manager is 100% regardless of CPU count.
* Highest possible CPU usage in Activity Monitor is number of CPU cores * 100%

I understand that part. My concern is that Firefox (when completely idle) uses almost all of one CPU. It shouldn't use any.

I also understand that it may be a Firefox problem. However, previous versions of Firefox didn't do it, and current Chrome doesn't do it, and I think it only happens in a Parallels VM (I still have to check version numbers on a regular (non-VM) Windows/Firefox test.)

I'm wondering if Firefox is doing something that it expects to be handled easily by a GPU, but Parallels has to spend a lot of CPU cycles emulating.
 
I'm wondering if Firefox is doing something that it expects to be handled easily by a GPU, but Parallels has to spend a lot of CPU cycles emulating.

1) Could you please post a screenshot of TaskManager when Firefox is running (there is none in original post)?
2) Could you please add 'vm.assert=1' flag to boot flags of your VM (Virtual Machine -> Configure -> Hardware -> Boot Order), start Firefox inside VM, wait for a couple of minutes and generate Problem Report (Help->Report a Problem). Please post ReportID here.

Thanks.
 
1) Could you please post a screenshot of TaskManager when Firefox is running (there is none in original post)?
2) Could you please add 'vm.assert=1' flag to boot flags of your VM (Virtual Machine -> Configure -> Hardware -> Boot Order), start Firefox inside VM, wait for a couple of minutes and generate Problem Report (Help->Report a Problem). Please post ReportID here.

Problem ReportID=27678099

Screenshots below...thanks for your help!

Screen Shot 2013-08-16 at 07.26.32 (2).png

Screen Shot 2013-08-16 at 07.26.32.jpg
 
BTW, I tried Firefox-23.0 on a bare-metal Win8 machine. Displaying a blank page, all CPUs are close to 0%, with a few spikes to 2-3% when the task manager redraws.
 
Hi spacewrench,

could you please check whether the issue reproduces in Firefox with fresh profile (e.g. no third-party extensions/plugins)?

Also, please install Process Explorer (http://technet.microsoft.com/en-us/sysinternals/bb896653.aspx), run Firefox, open Process Explorer and find the process that consumes the CPU (should be Firefox itself). Double click on the process, select "Threads" tab, find the thread that consumes CPU, select it and click "Stack" button. Please post this stack trace here. Thanks.

BTW, I tried Firefox-23.0 on a bare-metal Win8 machine. Displaying a blank page, all CPUs are close to 0%, with a few spikes to 2-3% when the task manager redraws.

This is not a fair comparison, since you run Win7 in virtual machine.
 
could you please check whether the issue reproduces in Firefox with fresh profile (e.g. no third-party extensions/plugins)?

Very nice: new profile doesn't use CPU!

pborzenkov said:
Also, please install Process Explorer ... Please post this stack trace here.

It'll take a little while to collect this -- the version of Process Explorer that you linked doesn't include the debug libraries, so the symbols aren't available (or something like that). I'll have to install some other stuff before I can get a thread list.

pborzenkov said:
This is not a fair comparison, since you run Win7 in virtual machine.

Sorry, it's the best I could do. I don't have a Win7 bare-metal machine.

Anyway, I think you've helped me narrow it down to a rogue plugin in Firefox. I'll try to find out which one it was, and post it here.

Thanks very much !
 
It'll take a little while to collect this ...

Damnit! I installed the MS debugging stuff, but when I started Firefox to collect the trace, it updated itself automatically. And the updated version no longer gobbles CPU.

So, Problem Solved, but I think it was a Firefox problem, not Parallels.

Thanks again for your help!
 
Back
Top